Quantified self: wearable February
What happens when a month becomes a material: On tracking activities, data humanism, and a bracelet that holds the analog habits of February
There is a version of data that lives on screens, in dashboards, charts, and spreadsheets, and a version that could live in the world. Not as a metaphor, but as an actual physical thing with weight and texture and presence. The tension between those two versions of data is something I've been thinking about for a long time. And this year, I started making something out of it.
My graduate program in Data Analytics and Visualization at MICA gave me the occasion to test that thinking in a contained form: a Quantified Self project with a non-traditional visualization requirement. When the assignment asked for something other than a bar chart, I didn't ask what would be different. I asked what form would be native to the content. And because I was tracking analog life, the answer was obvious: an analog output.
Quantified Self is not an unexplored concept, and has been moved forward in recent years by the likes of Georgia Lupi and Stefanie Posavec in Dear Data, as well as other practitioners such as Michelle Rial (Maybe This Will Help) and the Quantified Self community. This idea, combined with Data Physicalization is what drove the concept behind my project.
Project overview
This project is a condensed offshoot of a project I’d already started: a year-long experiment in habit tracking and data materiality that I've been quietly designing and building. I'm not ready to share the full system yet, and where I plan to take it. But I want to share where it started, and what it's already made.
This year-long project came from a desire to get offline and back into analog habits that both feed my soul and quiet my mind. I've been tracking five analog habits daily:
Move - body in motion (walking, running, biking, SUP, yoga, swimming, etc)
Make - authorship and creative expression (painting, drawing, crafts, jewelry design, etc)
Play - structured or unstructured fun (puzzles, games, LEGO, coloring, parks, beach, etc)
Read - books, any kind (magazines and newspapers don’t count)
Nourish - care through preparation (cooking, baking, gardening)
These are binary and defined as present or not present. No time tracking, no streaks, no scoring. Just: did I do something, whether for 5 minutes or 5 hours.
And my planned outputs are data art and wearable data where I can combine artistic and making skills with my data and visualization skills.
About February
This contained grad school project served me well as an experiment for my overall path forward, especially since the requirement was a non-traditional visualization. And for this project, my final output was a bracelet.
The process
Tracking: a simple spreadsheet with columns and binary options: Y/N with a notes column available for extra context should I choose to use it
Consolidating, notating, sketching: I used paper to summarize and brainstorm the actual materials I wanted to use for my final design
Visual inspiration: I used photos from the month of February to serve as my color palette and the overall look and feel for my final bracelet design
Visual experimentation: I got out my stash of beads and brainstormed several variations of style and color palettes
Encoding and assembling: the actual making of the bracelet after clearly encoding definitions were established
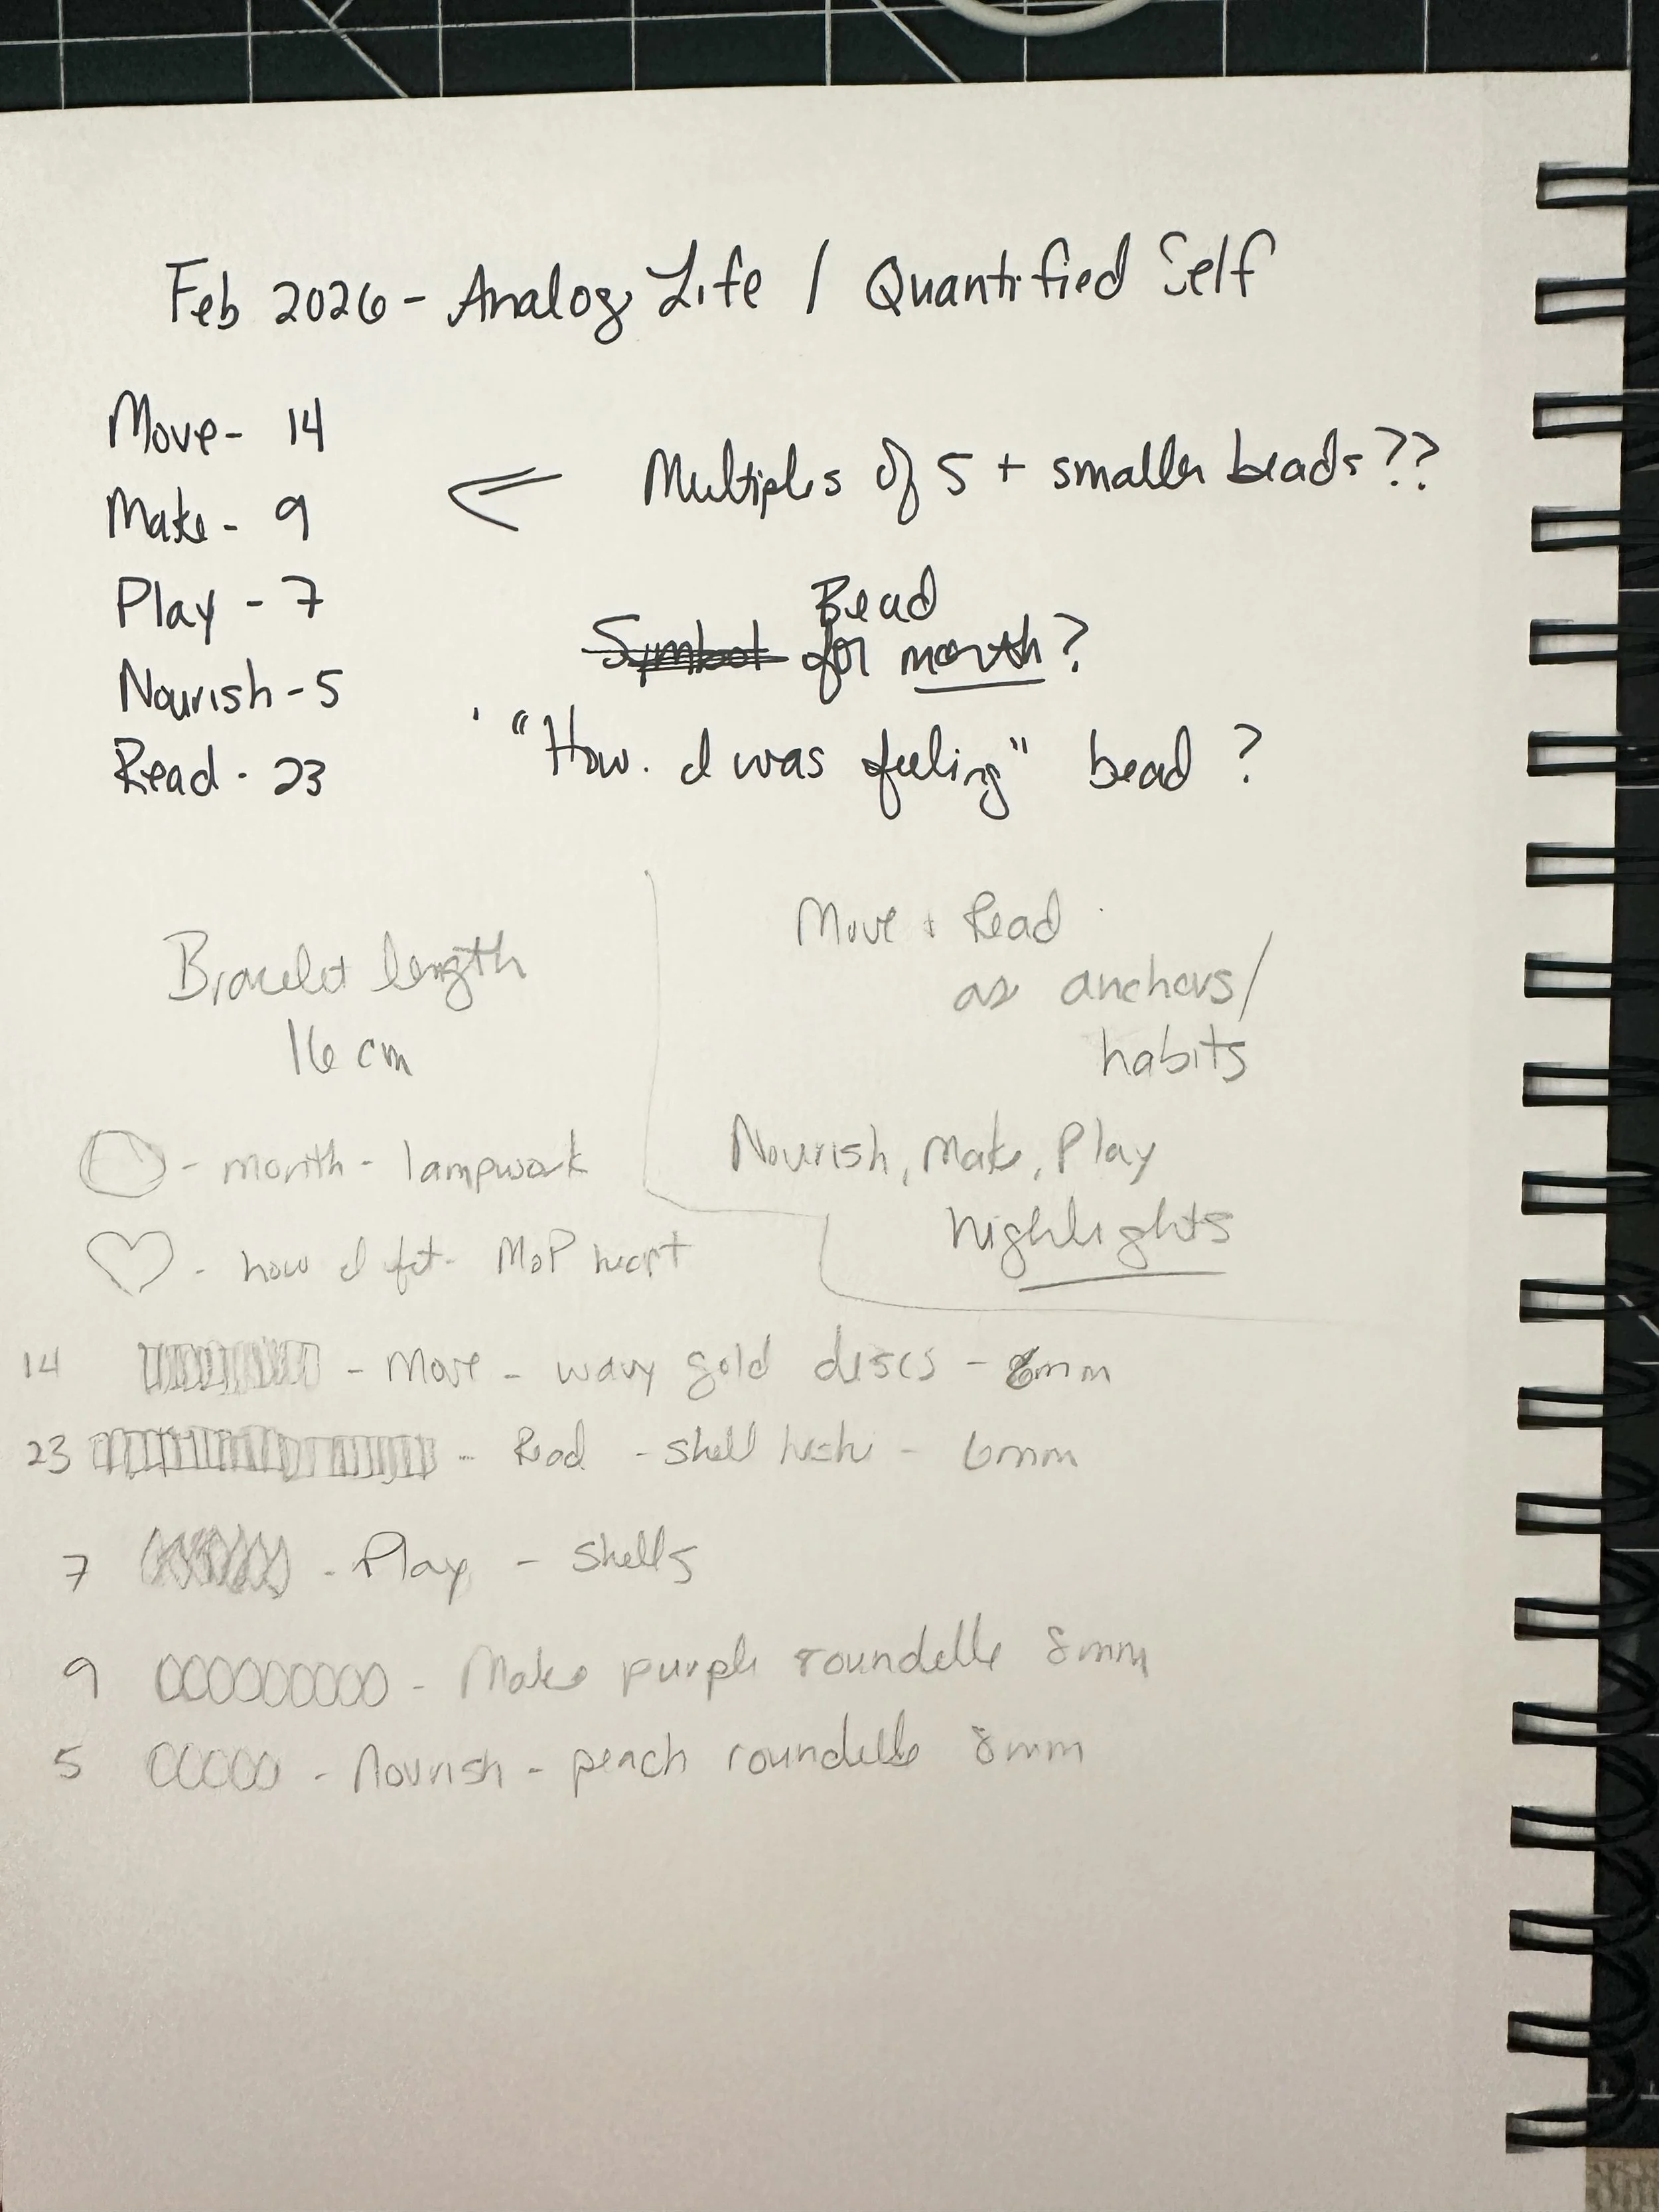
Summarizing, notating, brainstorming
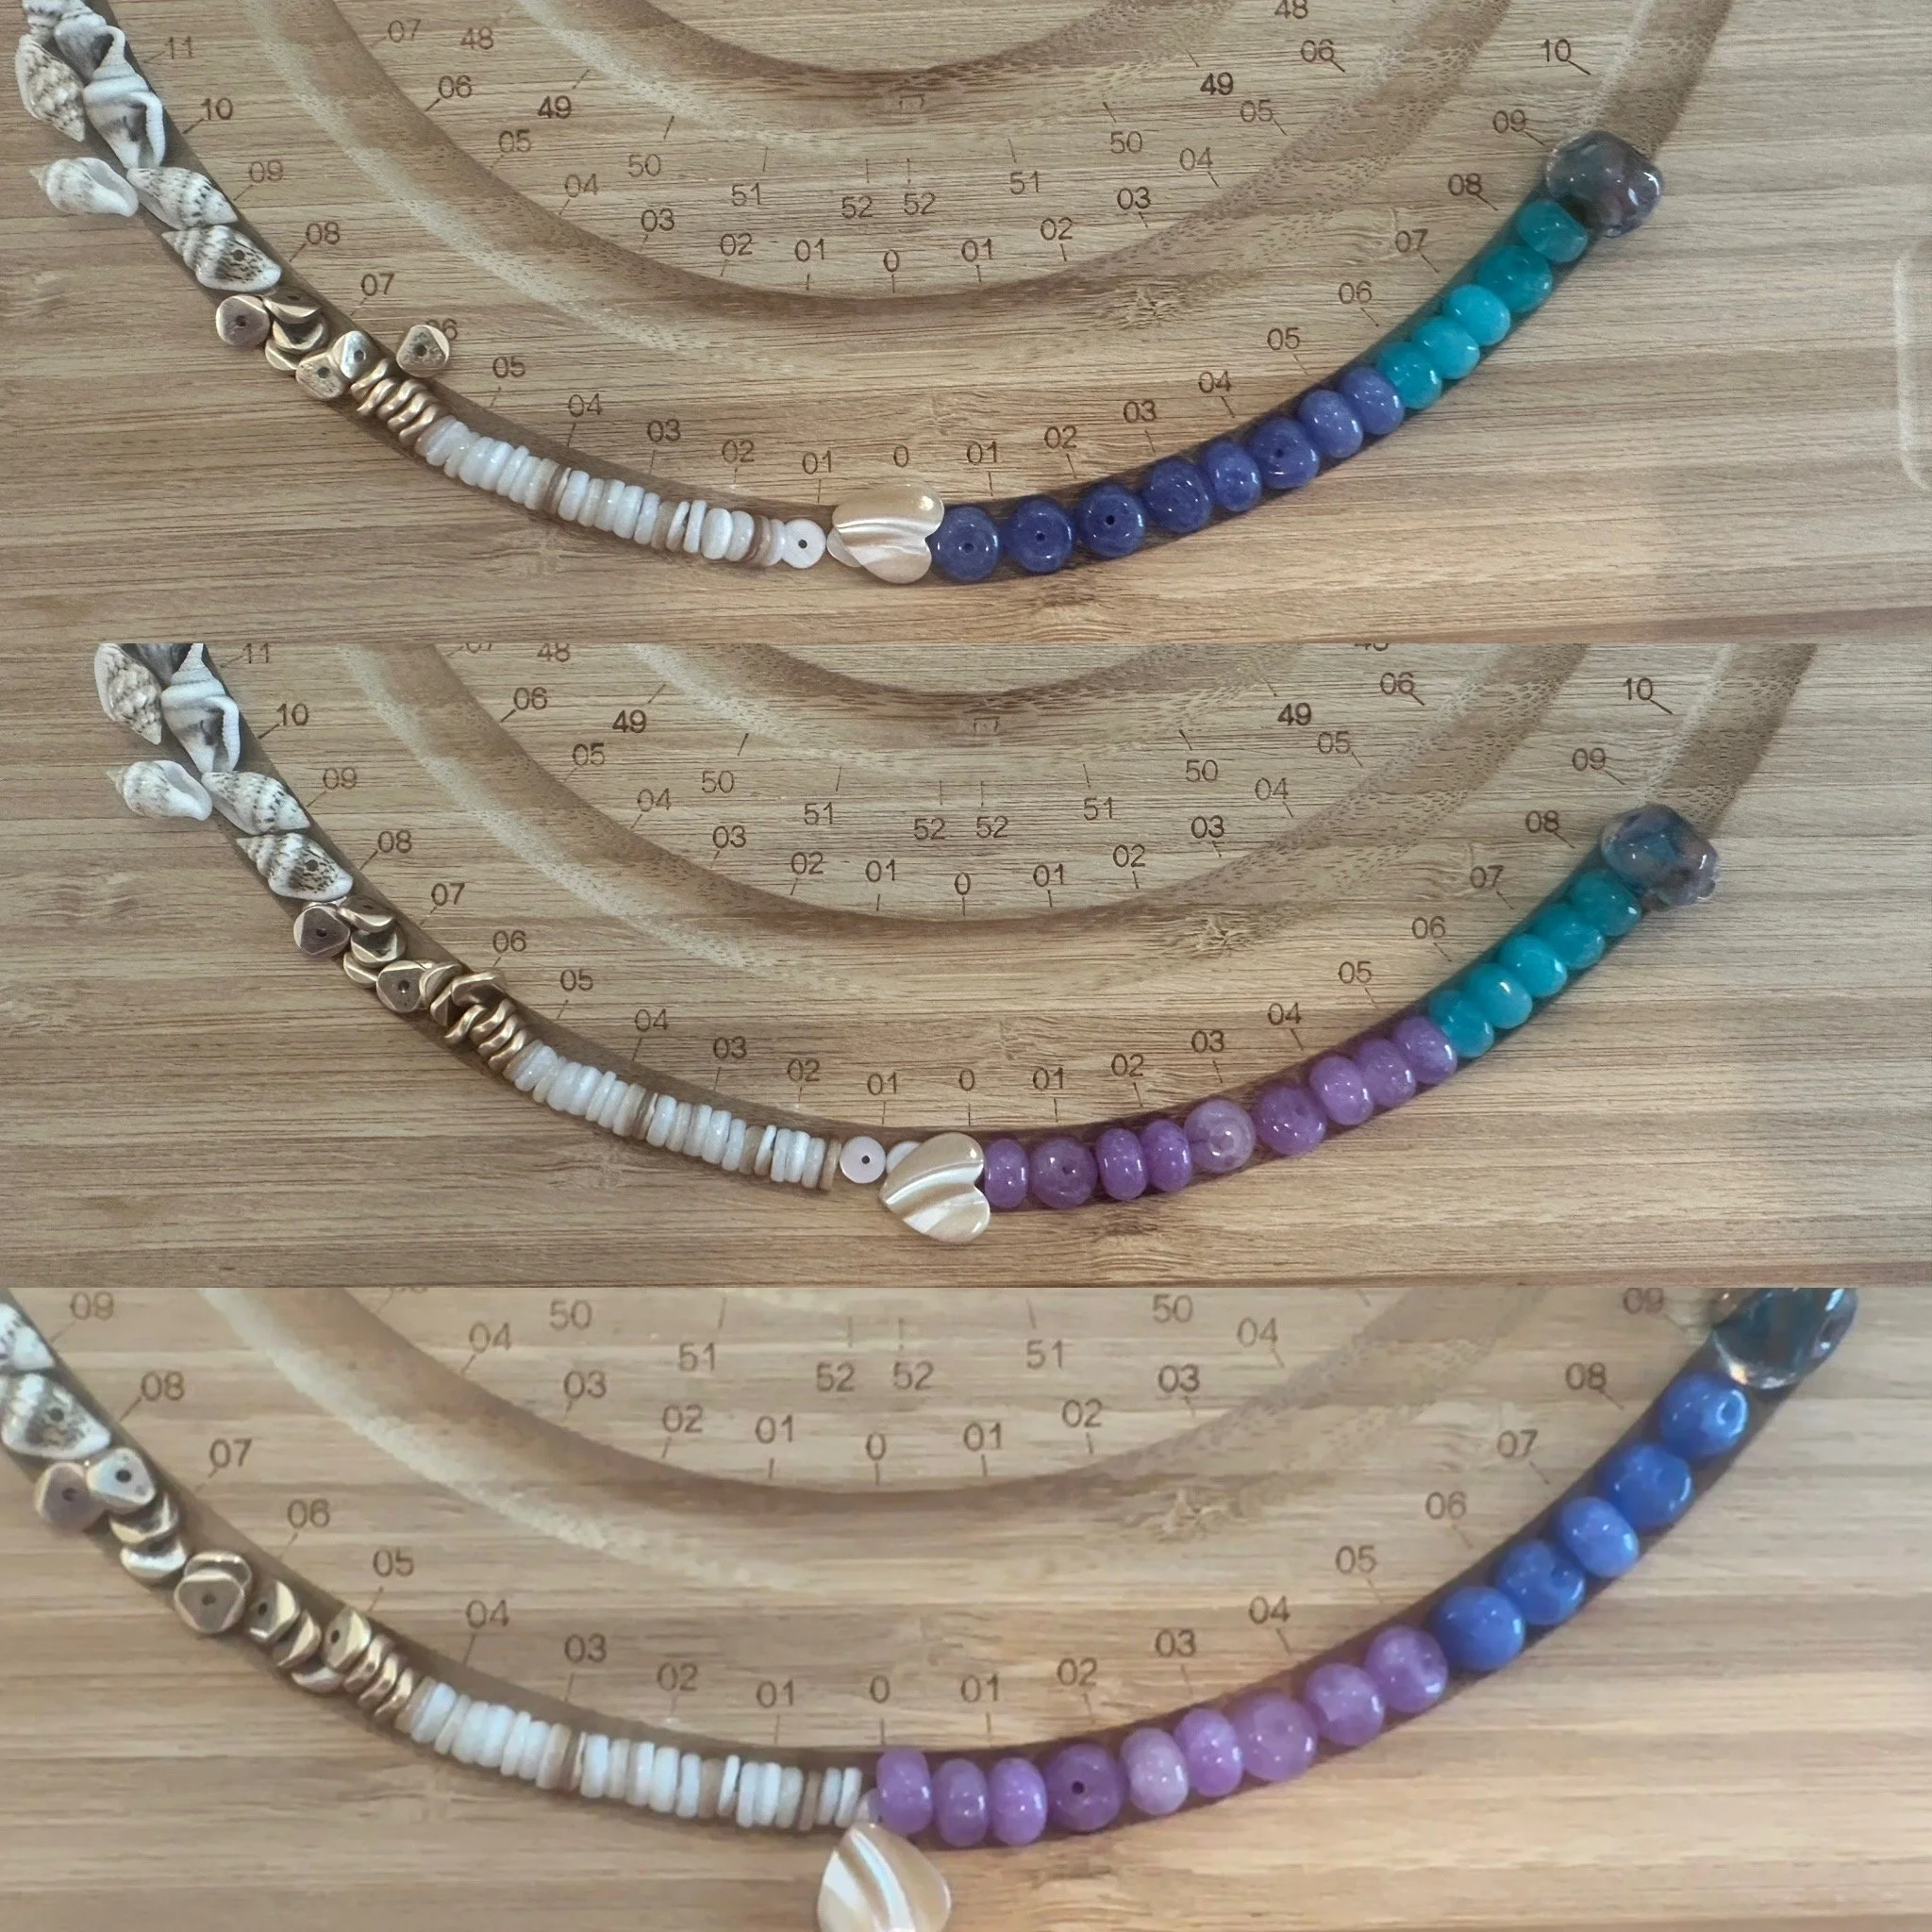
Bead size and color experiments
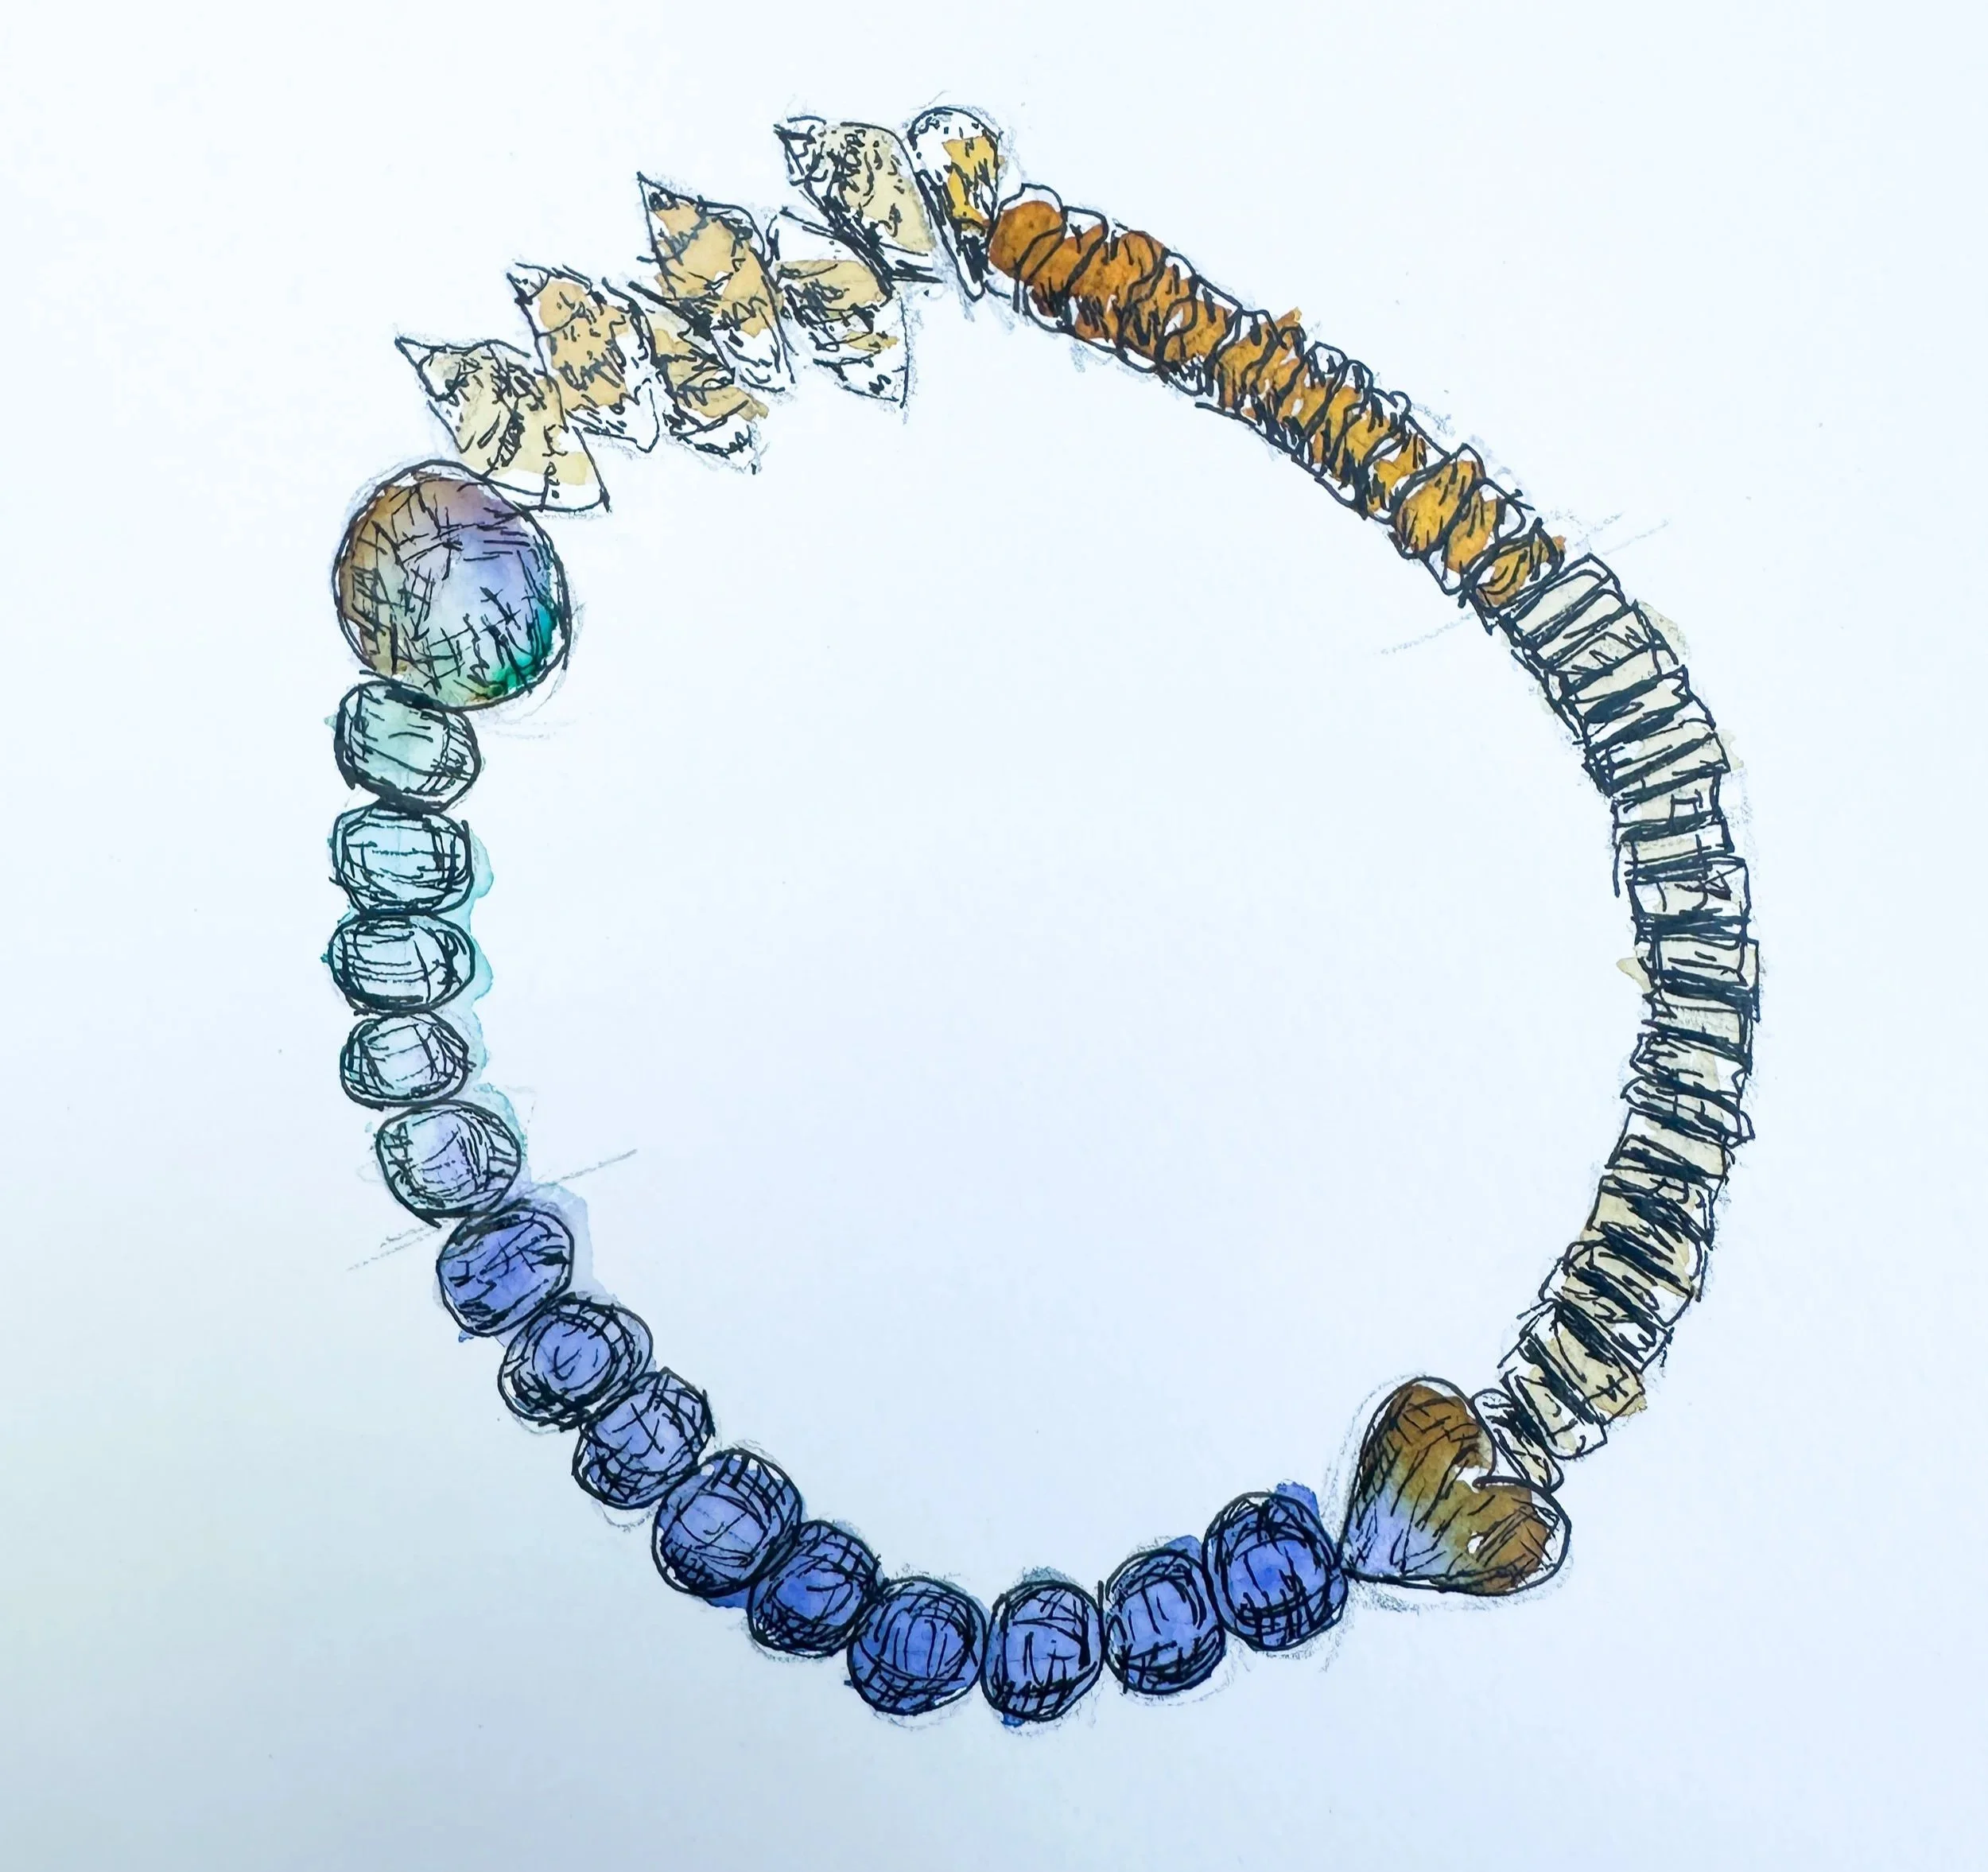
Sketch of my final color palette idea
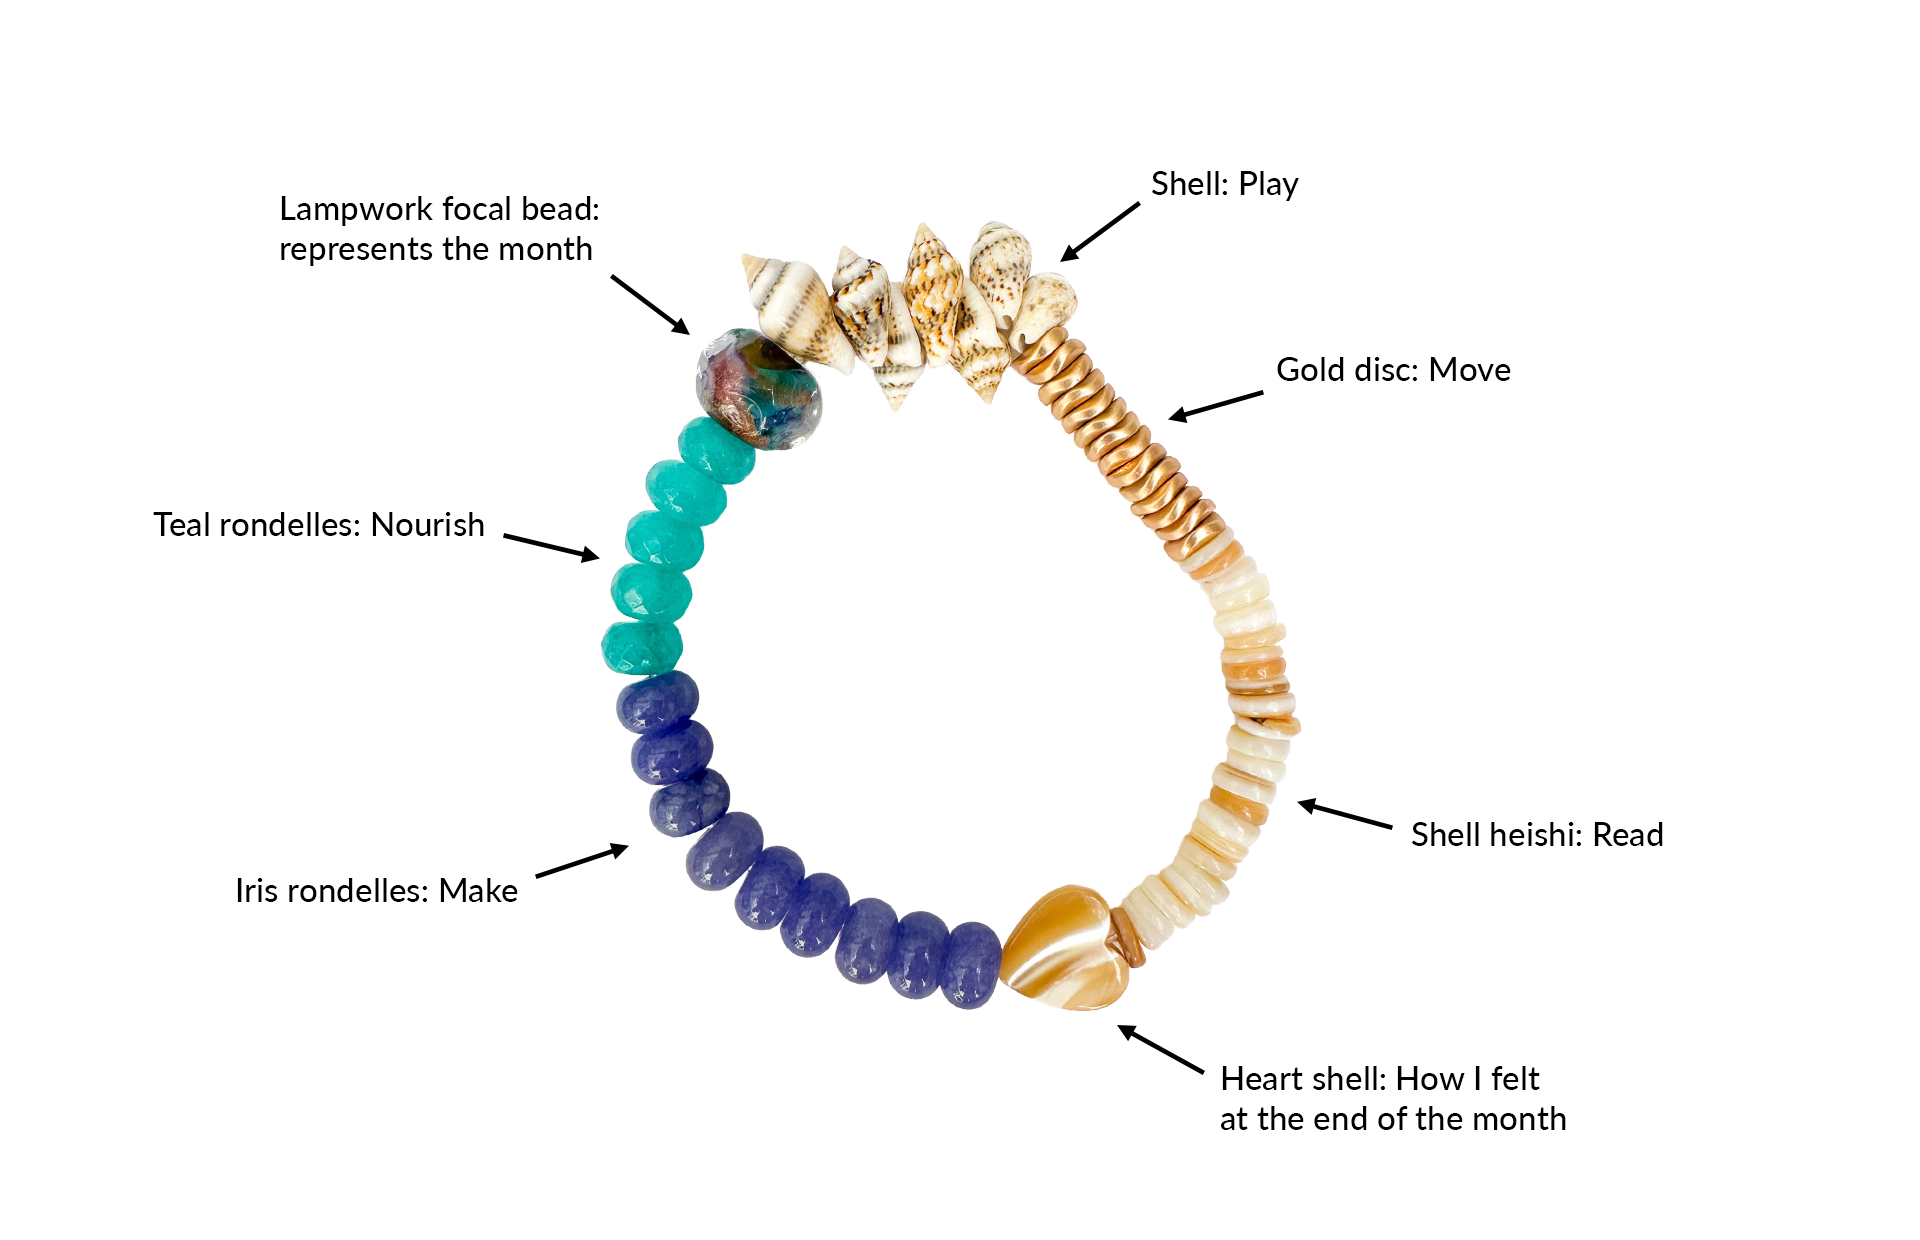
The encoding
Every Y became a bead. That was the foundational rule.
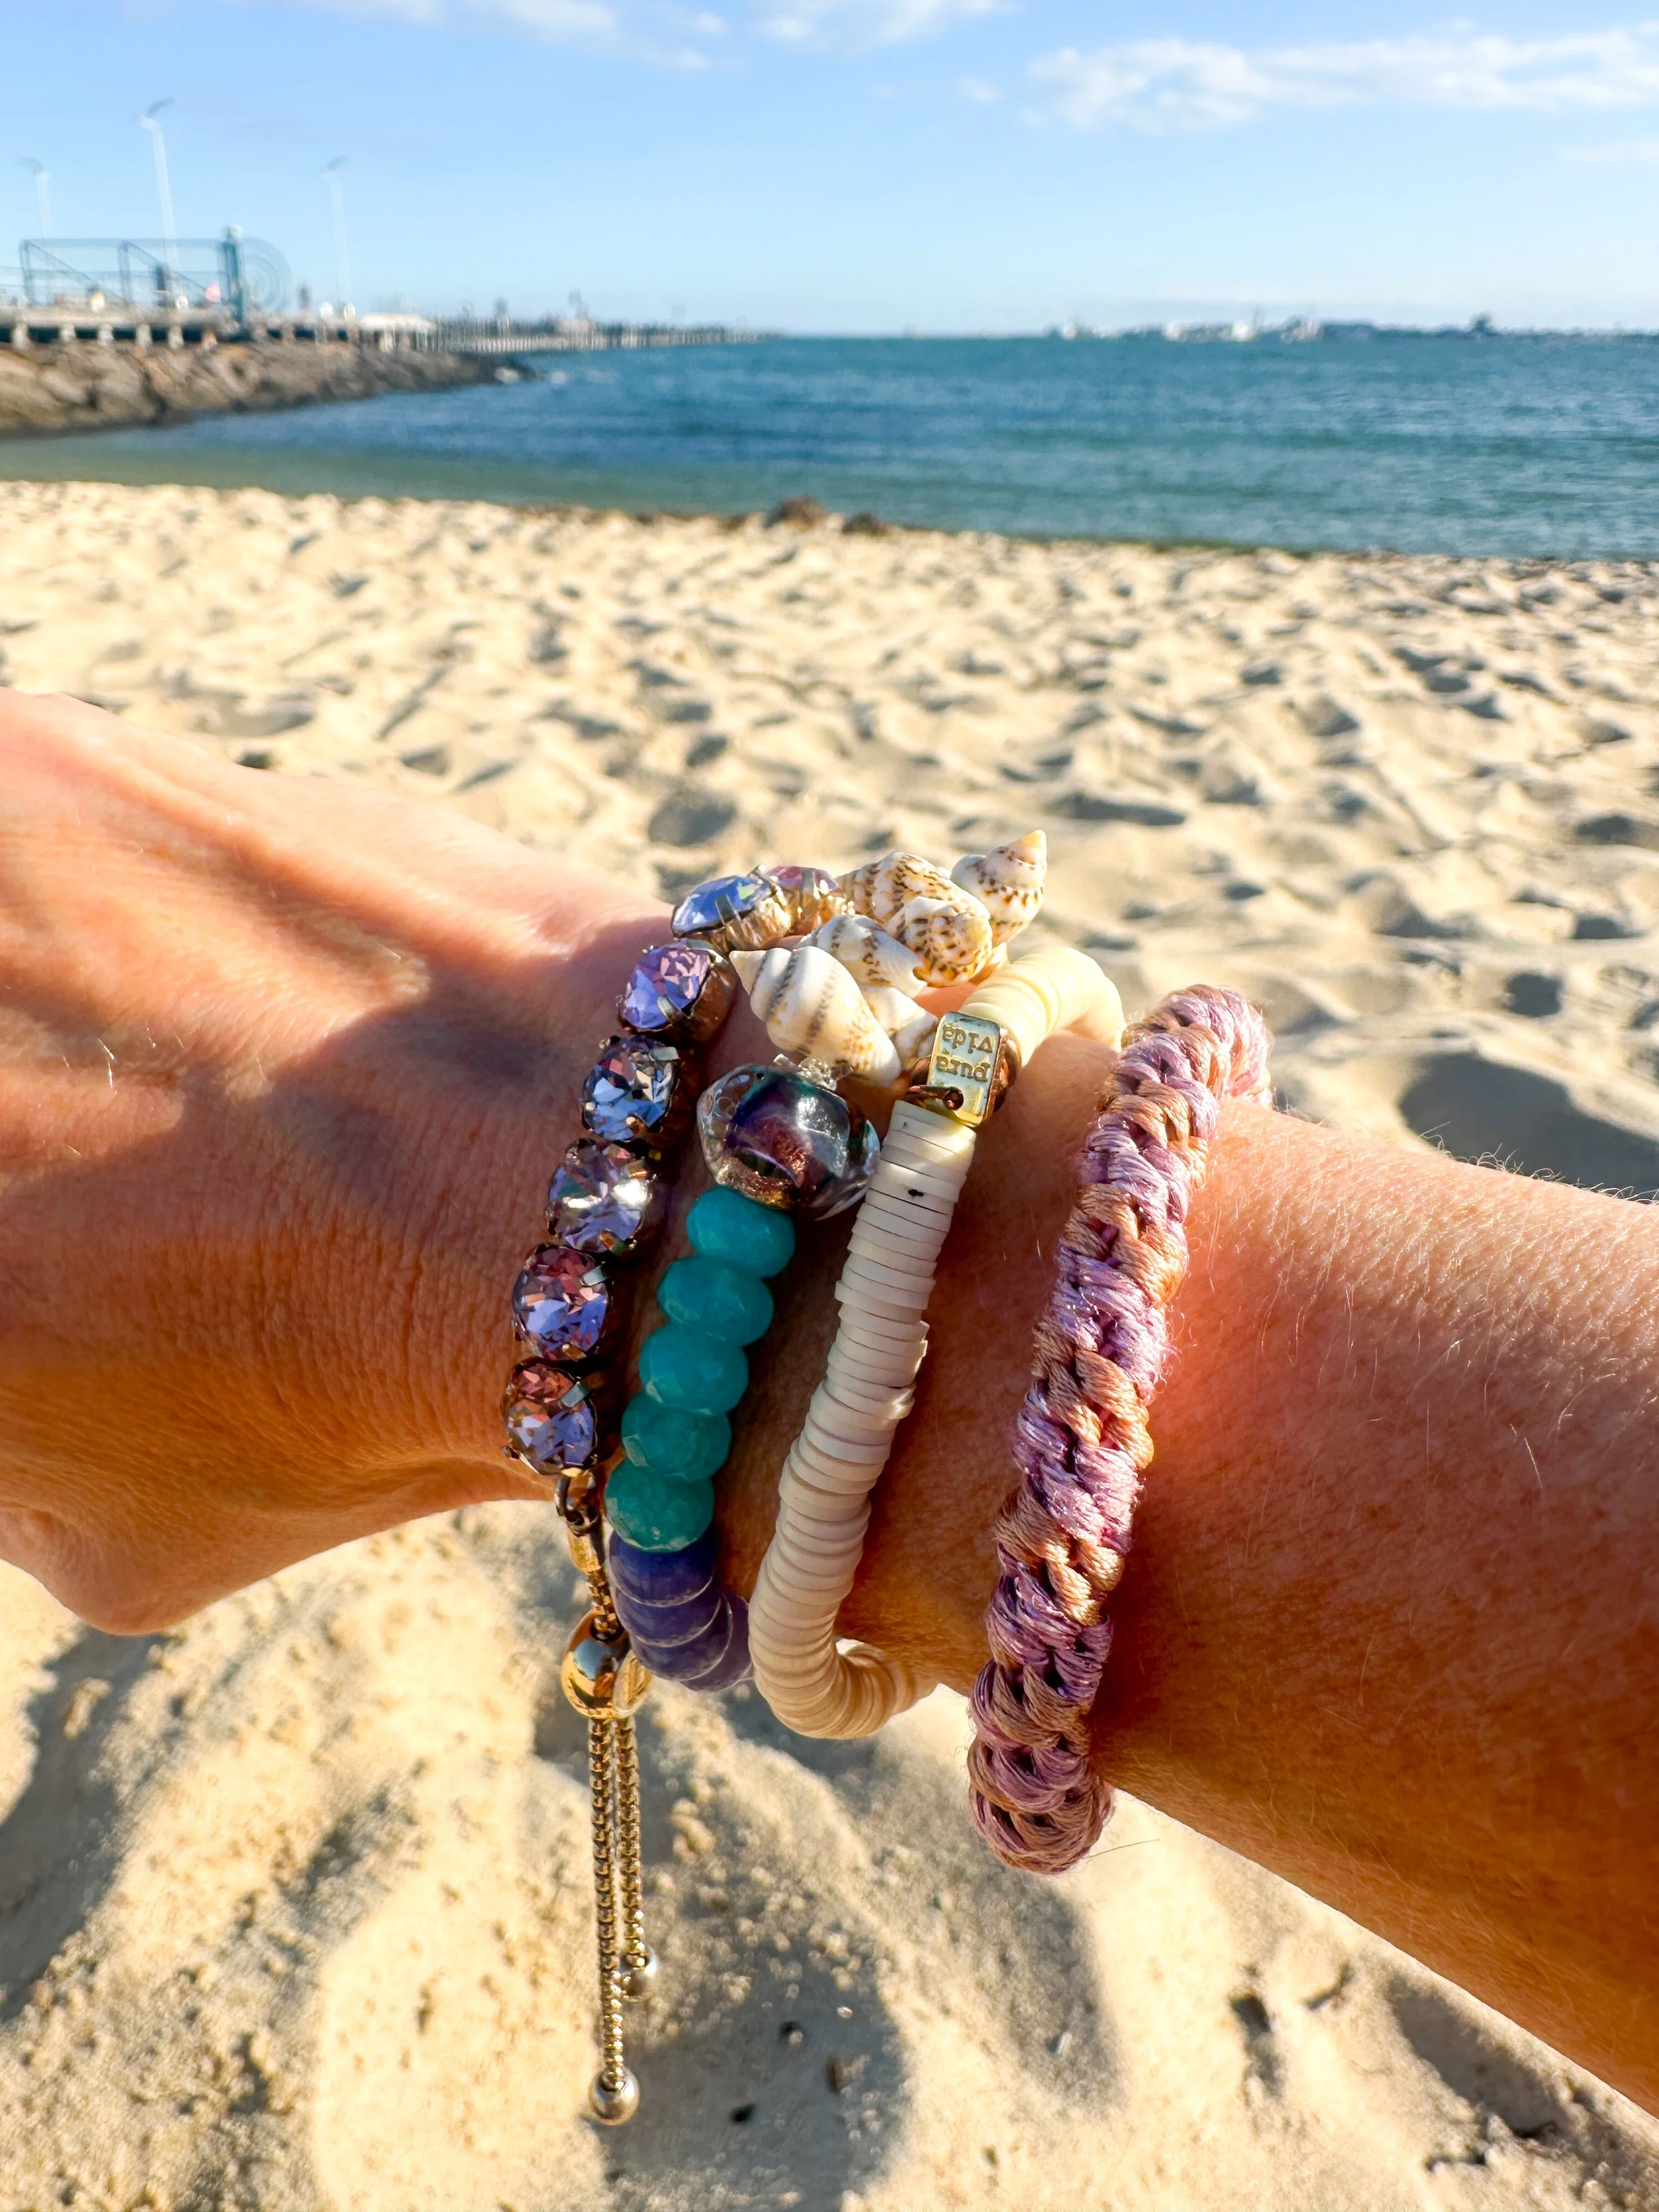
Move: Gold disc beads — rhythmic, grounded, a consistent baseline
Read: Shell heishi — the quietest material for the most frequent habit
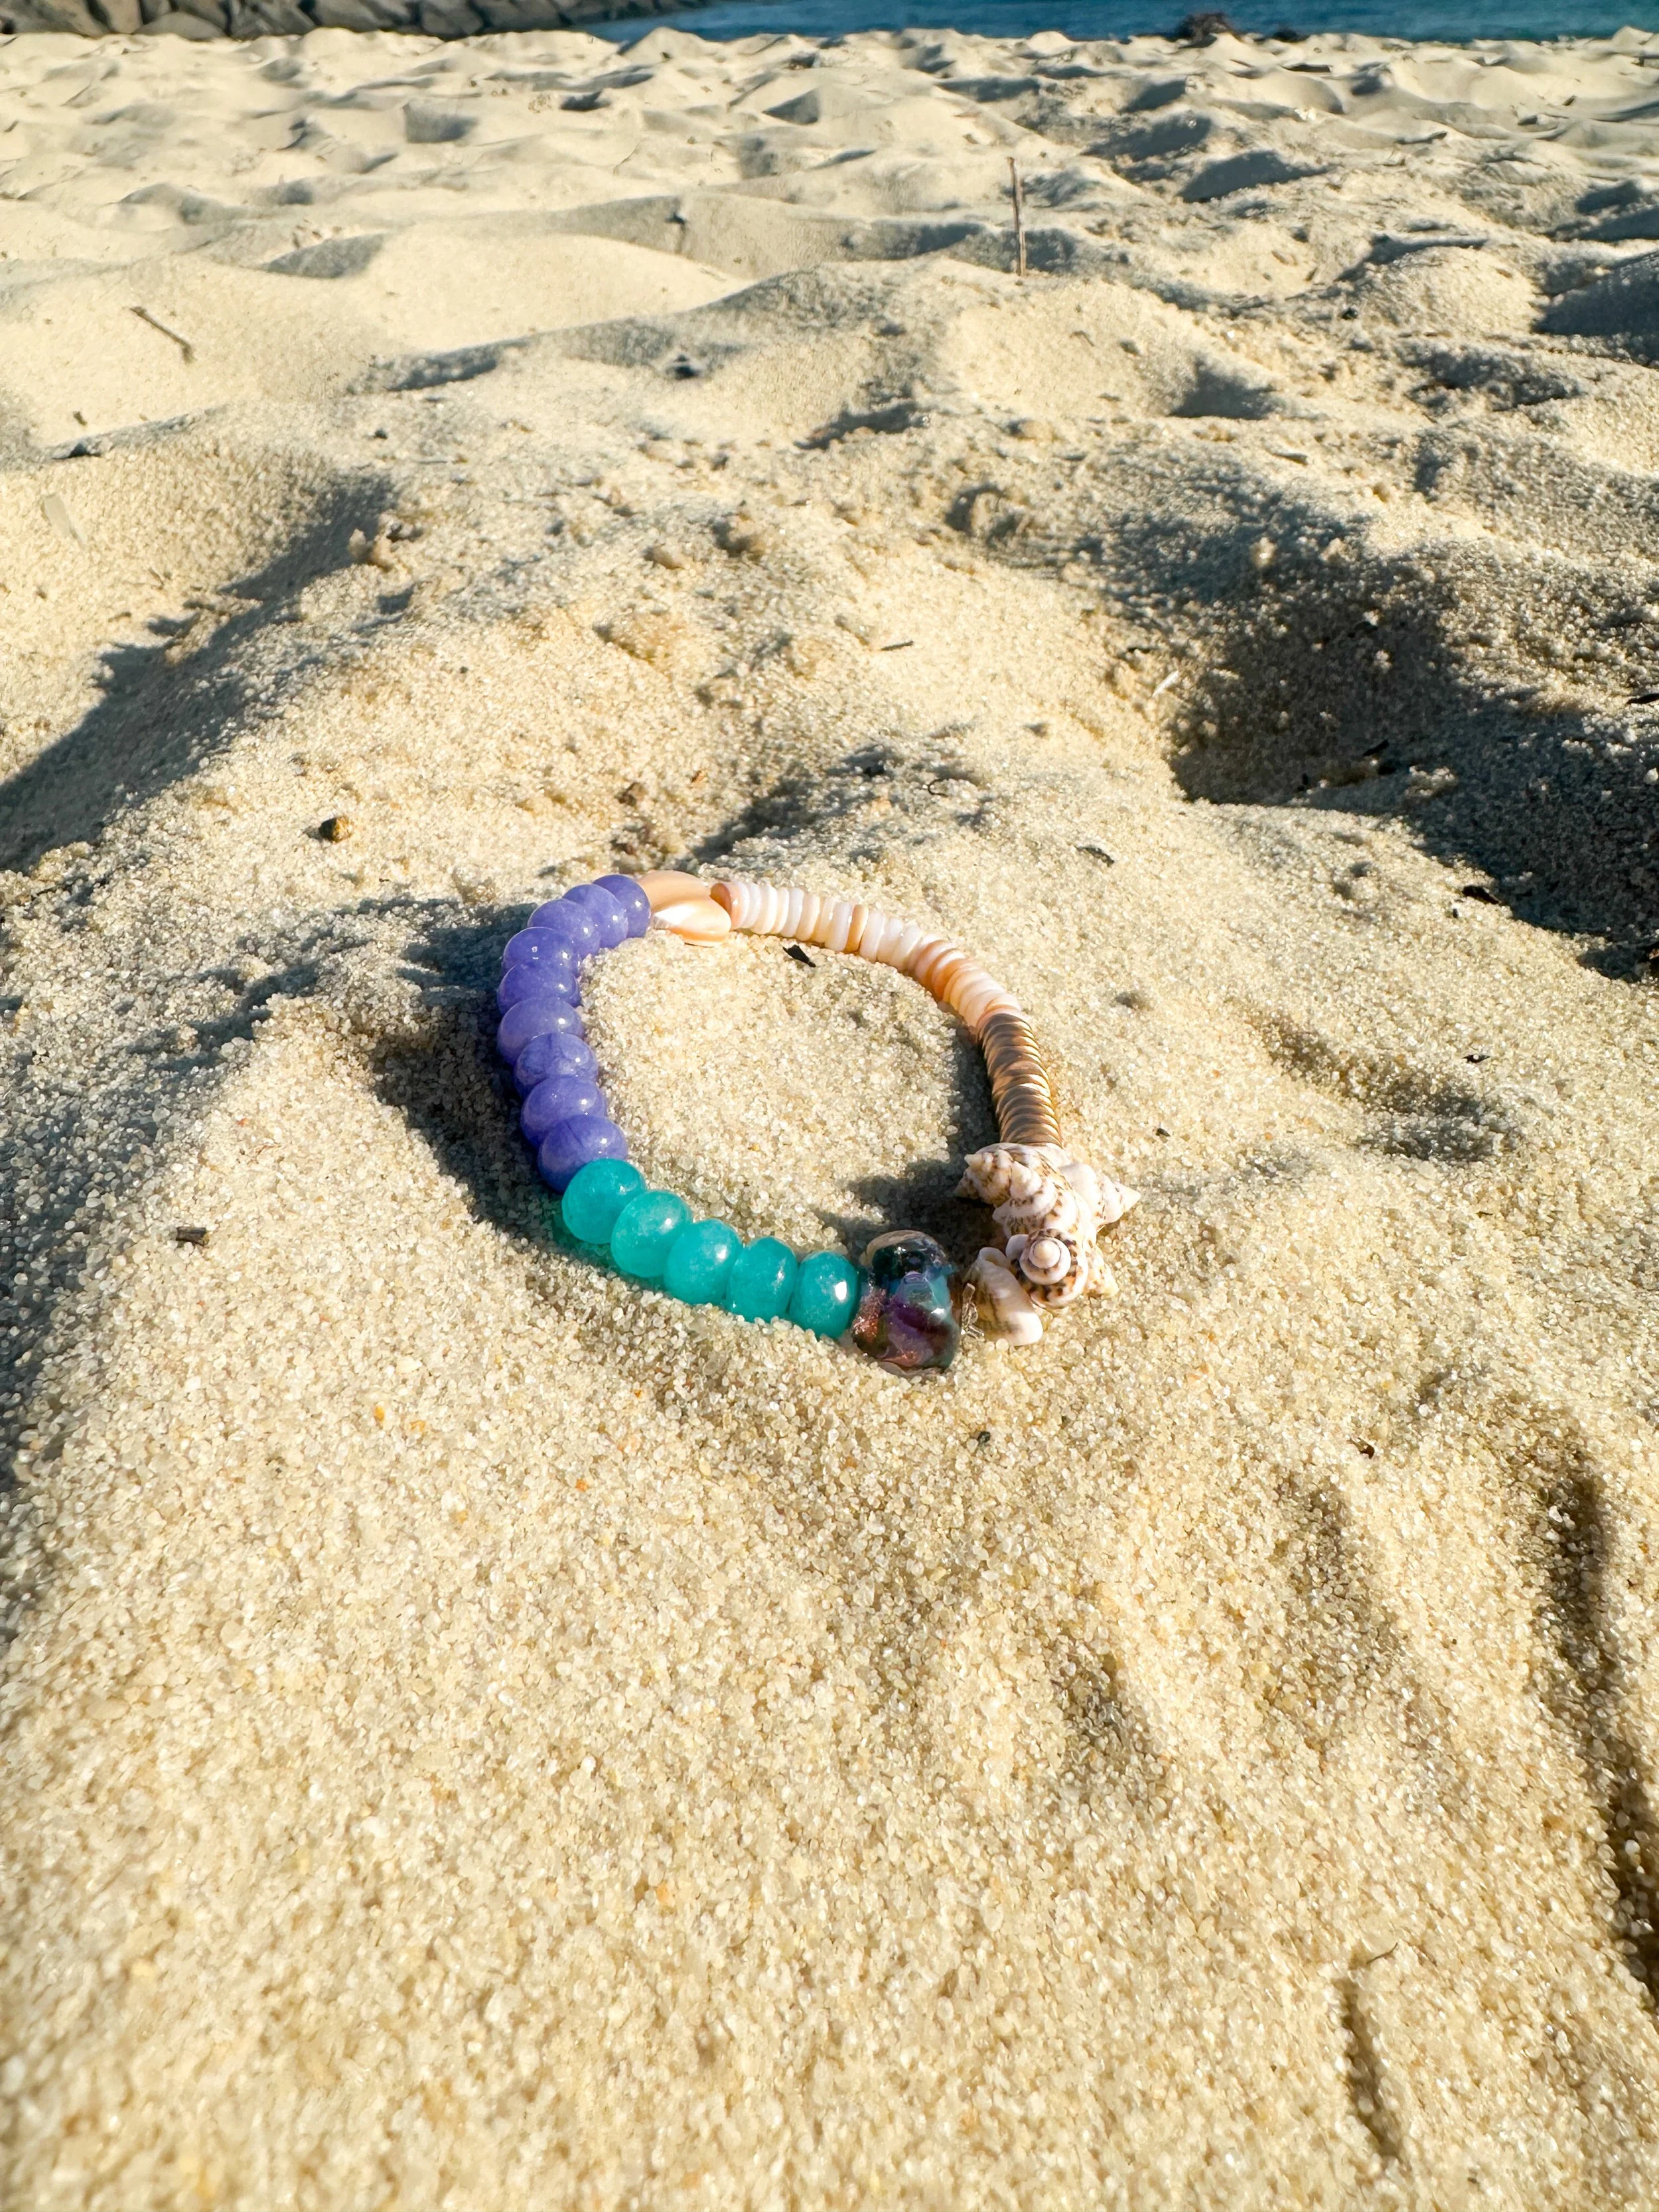
Play: Shells — because most of my play this month happened at the beach
Make: Iris-toned purple rondelles — a little iridescent, a little unpredictable
Nourish: Teal rondelles — blue-green, because green felt nurturing but true green would have broken the palette
The month itself: A single large lampwork bead — one anchor to timestamp the piece, chosen first, letting it lead everything else
How I felt at the end: A heart shell. February ended with family, creativity, and learning. I felt good. That's in there too.
One decision I'm particularly glad I made: I created intentional visual balance between the habits that quiet my mind: reading and movement, the longer runs of simpler beads, and the habits that feed my soul, which were fewer in count but got the more interesting materials.
The data says I did the former more often. The design says both matter equally. Those are different statements, and I wanted both to be true simultaneously.
Design meets data: the challenges and choices
A standard bracelet is 16cm. That constraint became the most interesting and challenging part of the project. How do you represent 23 days of reading and 14 days of movement and still have room for everything else? You have to think about data density. About legibility. About what gets foregrounded and what recedes.
These are exactly the same tensions you navigate in any visualization work: signal vs. noise, clarity vs. completeness, what you choose to show and what you deliberately leave out. Except here the medium has weight and texture, and it must sit well on the wrist. I had both a fashion problem and a data problem to solve. I worked through this using bead size, color, and material, varying based on my encoding rules.
What I keep coming back to is this: a dashboard tells you what happened. This bracelet lets you feel what the month was. Those aren't the same thing, and I think that gap is worth a year of work.
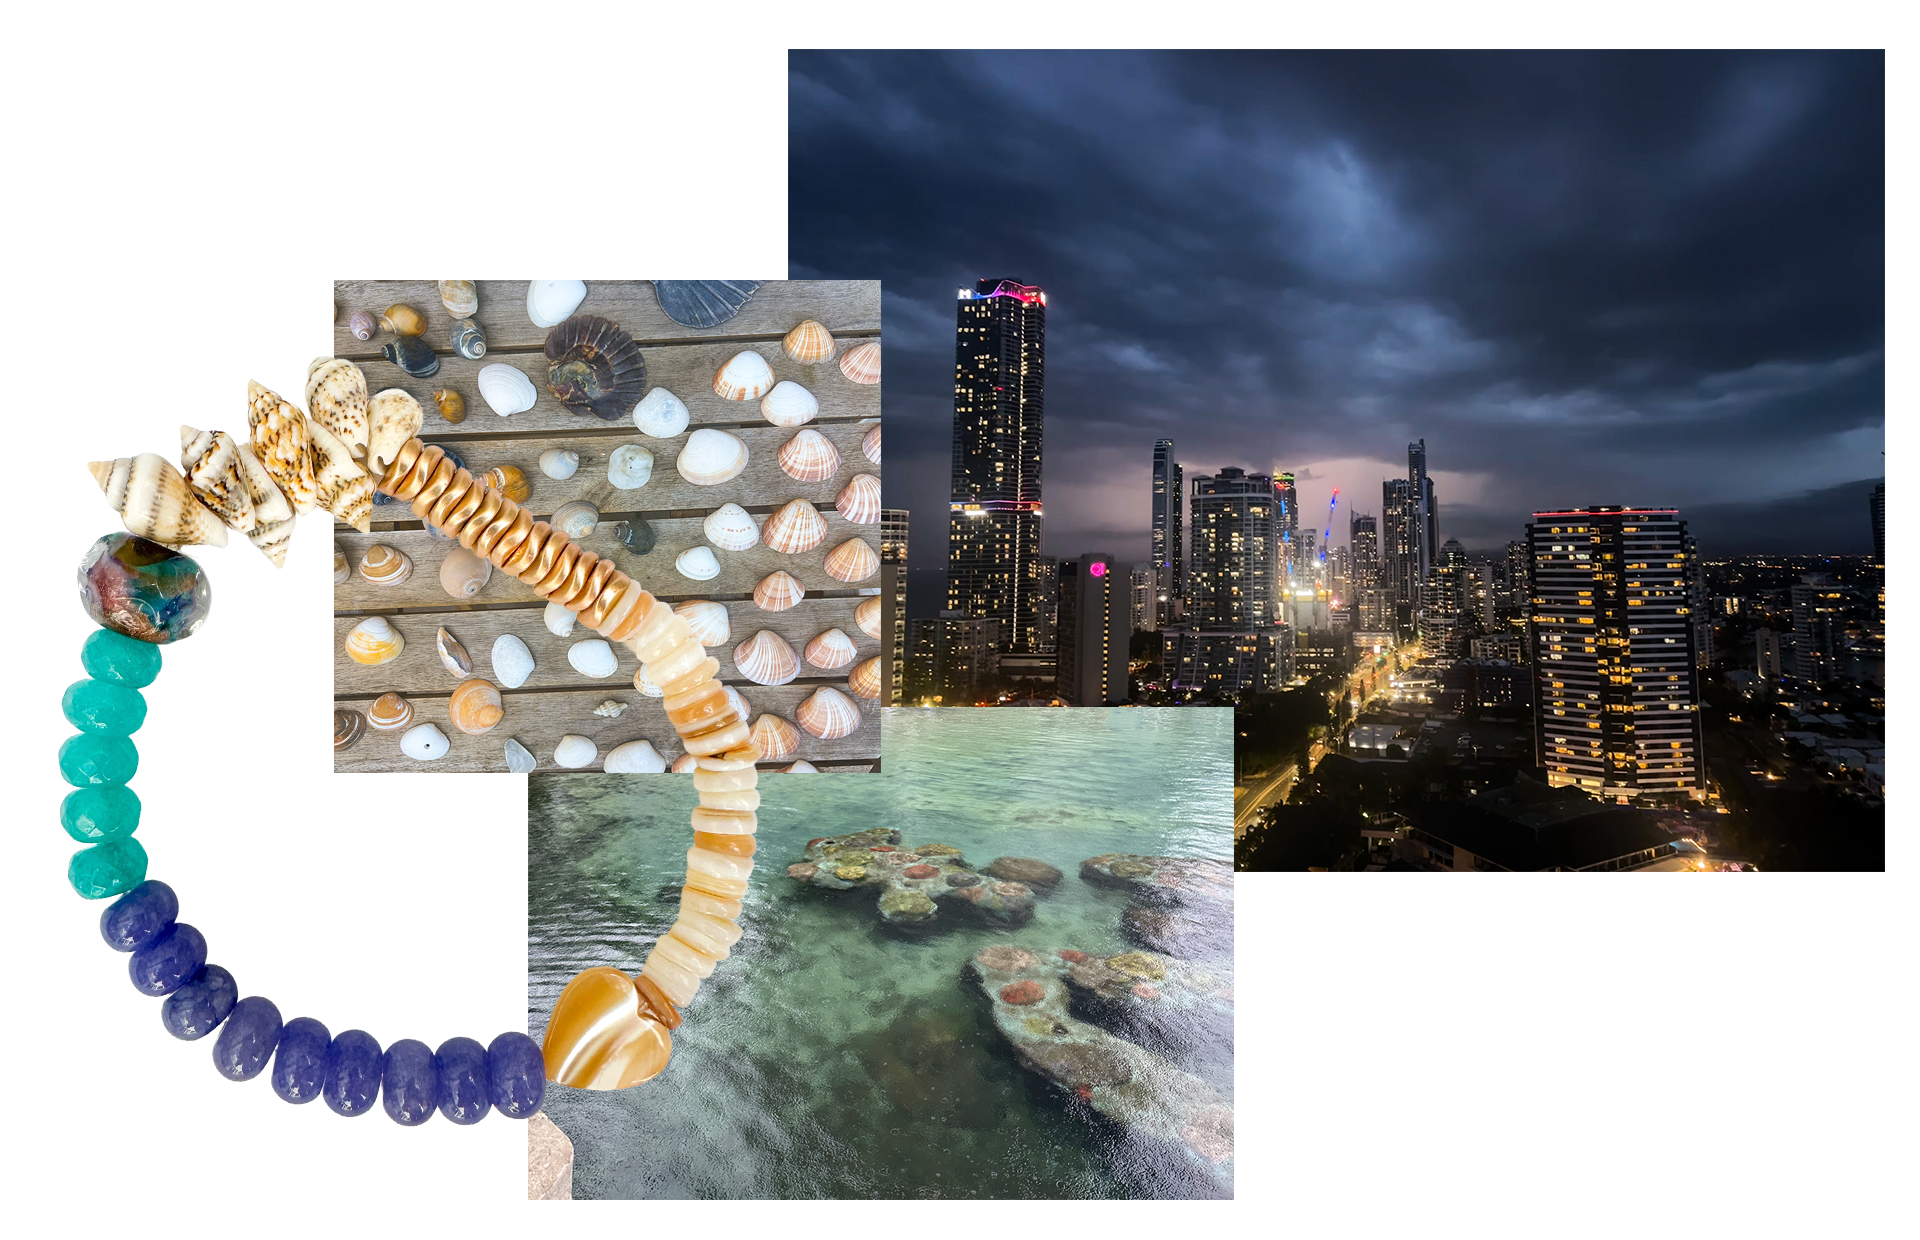
The final design and the photo inspirations
The challenge ahead
This bracelet is one piece of a larger system I've been building and designing — a year-long practice that moves data through three progressively less precise layers, ending in something physical and irreversible.
I'll write more about the system when the time is right. For now: this is February. I’m working through the rest of my year, and will need to address several open questions as I go:
February is a short month. What happens when I have 30 days of a few things?
I’d like need to start looking at one bead being a multiple with smaller beads of the same color rounding out the one-offs beyond the multiples. I’d also need more varying sizes, which will create interesting balancing challenges for wearability.
This doesn’t always have to be a bracelet, but I must be jewelry. And it must maintain some kind of encoding cohesion so that I not only build a full data story, but a visual collection.
But for now, February is done, and I’m mulling through these questions as I work through my year. I’ll post back later when I have a substantial update. And as for the remainder of grad school: I plan to deepen my practice in immersive data art, exploring concepts in visual arts, fashion, crafts, movement, and sound.